
Reconstructing Causal Sequences from Asynchronous Telemetry Stream Aggregations
Asynchronous telemetry stream aggregations obscure causal order, requiring logical counters, topology mappings, and buffered watermarks to reconstruct events.
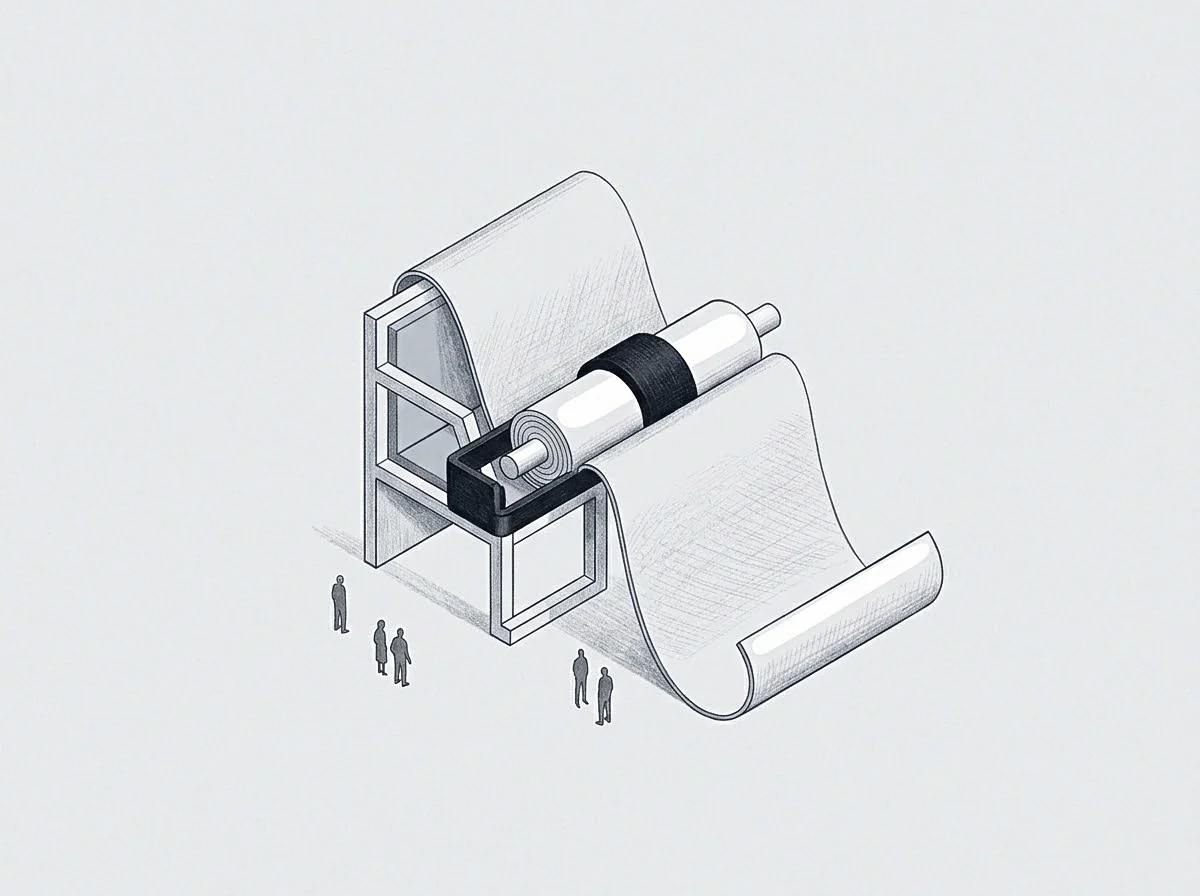
Clock
An infrastructure operator and an engineering founder sit before three terminal displays twelve hours after a cascading outage. Each screen presents a distinct time series for the identical database tier. The operational metrics show a memory saturation point marked at forty seconds past the minute.
Application telemetry records the connection pool exhaustion at thirty-six seconds past that same minute. System event logs register the first failed remote procedure call at forty-four seconds. Recollections of the incident response already disagree on which service failed first.
The recorded data consists of batched counter increments, rolling averages, and asynchronous log flushes collected across forty virtual nodes without synchronized hardware timers.
Local timers drift across machines. The phenomenon of quartz oscillator instability produces variance between separate server motherboards, commonly running between five and thirty milliseconds of divergence per day under ambient thermal fluctuations. Network time protocols bound this offset under ideal conditions, yet packet transmission jitter and virtualization hypervisor pauses routinely introduce temporal skews exceeding two hundred milliseconds.
When systems aggregate events into coarse measurement windows, physical timestamps lose their capacity to establish causal priority. A database write that triggered a downstream cache invalidation may bear a timestamp numerically later than the invalidation itself.
Causal order remains recoverable only when telemetry payloads carry explicit logical sequence identifiers before collection pipelines aggregate events into temporal windows.
Distributed coordination algorithms establish partial orders through logical counters rather than wall-clock synchronization. Monotonic integer sequences increment with every internal state change and propagate across network boundaries inside remote procedure headers. When service boundaries lack these propagated headers, the telemetry aggregation pipeline receives disconnected streams whose temporal relationship cannot be reconstructed through coordinate comparison alone.

Physical Dispersion Across Distributed Nodes
Hardware timers operating in separate geographic regions experience variable latency during telemetry transmission. A telemetry collector running in a central region receives stream batches over public network routes that fluctuate under routing changes and localized congestion. An event occurring at an edge node in Frankfurt reaches the ingest queue sixty milliseconds after an event occurring in Virginia, despite the edge node having processed its transaction thirty milliseconds earlier.
Telemetry transport queues buffer events locally to optimize bandwidth, releasing payloads in five-second micro-batches. Physical time leaves no clean trace.
Topological distance between collection agents introduces differential delays that distort temporal sequence. A service operating under heavy load flushes telemetry buffers sluggishly, while an idle upstream service transmits operational records instantaneously. The centralized monitoring system records the upstream behavior as an antecedent phenomenon simply because its packets arrived first at the ingest interface.
Causal attribution based solely on time-of-arrival attributes failure to the earliest reporter rather than the root activator.

Logical Order Over Drifted Timestamps
Directed causality requires an explicit dependency graph. Lamport counters resolve total precedence within isolated system pathways by maintaining a non-decreasing integer scalar incremented on every operation. When an execution context passes between independent microservices, the outbound envelope carries this counter value.
The downstream worker advances its local counter past the inbound figure before recording telemetry items. The recorded counter provides a mathematical proof of execution sequence that survives transmission latency, host timer drift, and batch collection pauses.
Vector counters extend this discipline across concurrent execution paths. By maintaining an array of logical clocks representing every participating node in a consensus cluster, an event payload records not only its immediate predecessor but the complete set of distributed states known to that node at execution time. Telemetry aggregators that strip vector arrays to conserve storage discard the causal record.
The resulting data points compress into flat scalar distributions where concurrent operations appear sequentially dependent.
Order recovery requires preserving logical counters at every telemetry hop.

Bucket
Temporal batching compresses continuous execution events into discrete time steps. Monitoring agents routinely assemble metrics into fixed intervals of ten, thirty, or sixty seconds to reduce network ingestion bandwidth and storage volume. A service handling ten thousand requests each second cannot persist individual trace records for every operational step without paying significant throughput penalties.
The agent tallies total counts, sums durations, and computes percentile approximations within each discrete window. The internal sequence of operations executed inside that window disappears during the summation process.
Bucketing dissolves the preceding transaction. If a configuration deployment occurs at second twelve of a thirty-second bucket, and an error rate elevation begins at second fourteen, an aggregation window spanning seconds zero through thirty represents both occurrences as simultaneous aggregate features of that single interval. An operator reviewing the thirty-second bucket cannot deduce whether the error elevation precipitated the deployment rollback or the deployment provoked the error surge.
Temporal bucketing destroys precedence whenever the duration of an operational sequence runs shorter than the sampling window.
Reconstruction algorithms attempting to extract causal graphs from aggregated windows encounter confounding correlations. When two separate services report elevated latencies inside the identical sixty-second collection frame, standard statistical correlation measures treat them as mutually associated phenomena. The direction of the causal arrow cannot be derived from co-occurrence alone.
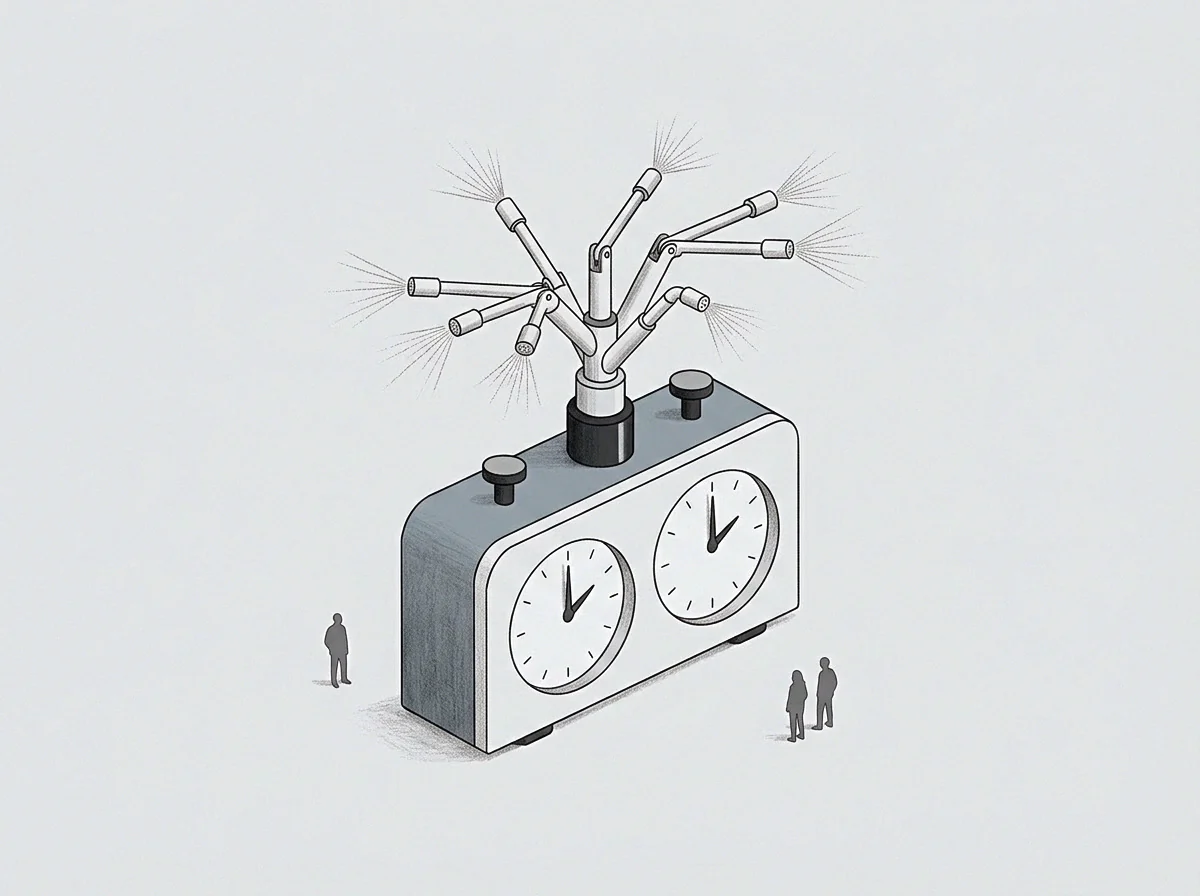
Where Do Concurrently Recorded Spans Overlap?
Overlapping spans inside an aggregation bucket indicate either concurrent execution, sequential pipelining, or independent resource contention. When a distributed tracing agent aggregates microservice execution spans into statistical summaries, it groups spans by service route and HTTP status code. Two independent requests passing through a common authentication layer produce identical aggregate metrics within the collection interval.
If the authentication layer experiences a transient lock contention that delays both requests, the recorded metric exhibits an elevated duration across both pathways without recording which request acquired the lock first.
The boundary edges of collection windows create artificial sequence ruptures. A causal chain of three events taking four seconds to complete will appear split across two distinct buckets if the chain initiates two seconds prior to a window boundary. Event one appears in window A, while events two and three appear in window B. The statistical correlation between event one and event two drops because their recorded counts reside in non-overlapping storage arrays.
- Window Alignment Skew alters apparent dependency structures when collectors on distinct hosts evaluate time boundaries against unsynchronized system clocks.
- Quantile Distortion obscures individual anomalous operations by merging severe microsecond-level latency spikes into broad rolling percentiles.
- Non-Commutative Aggregation prevents exact causal recovery because mathematical sum and average operations do not preserve execution sequencing. This loss remains irreversible once intermediate logs clear.
- Counter Rollover Anomaly resets monotonically increasing metrics to zero on process restart, presenting an artificial plummet that mimics upstream failure.
- Burst Smearing distributes a two-millisecond message queue backup across a full minute of averaged telemetry points.
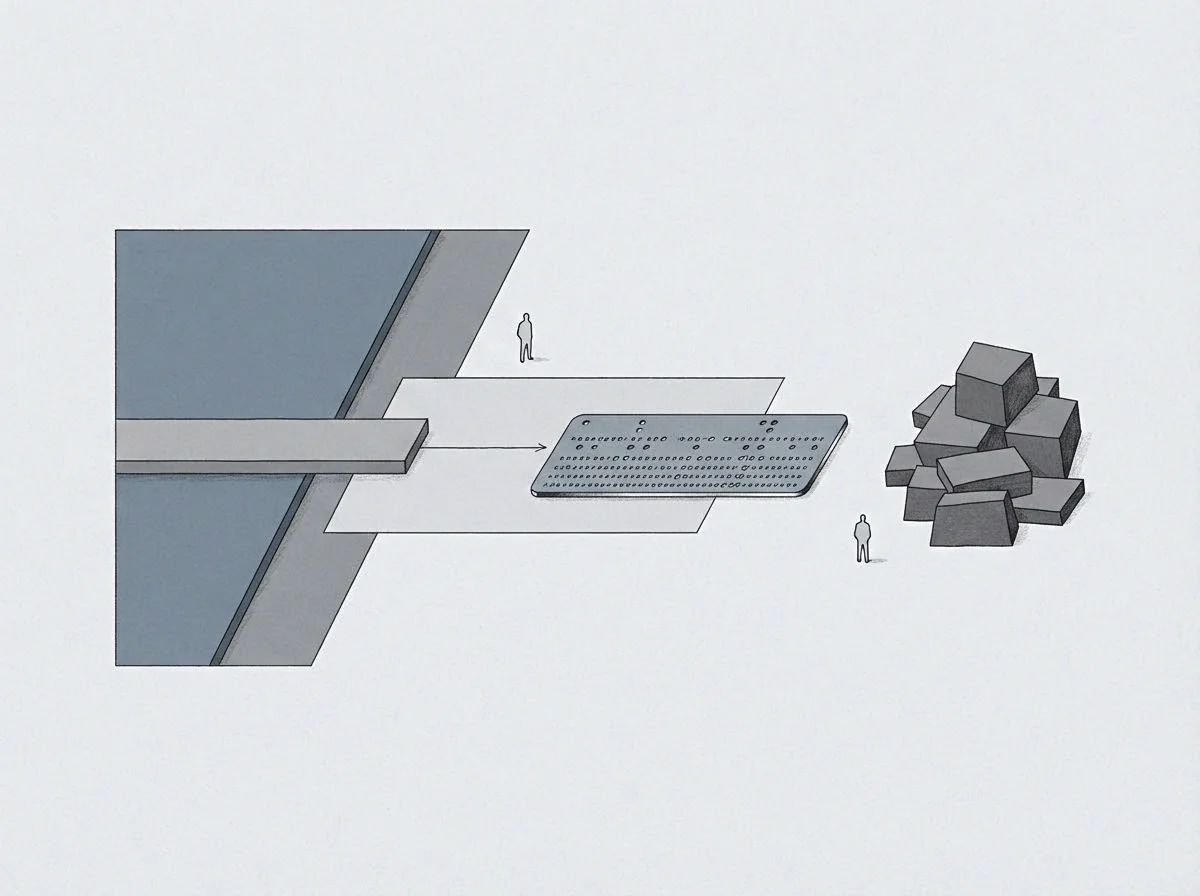
Information Loss in Temporal Compaction
Telemetry compaction engines employ downsampling algorithms to maintain predictable long-term storage footprints. High-resolution raw events captured at one-second intervals are merged after seven days into five-minute summary statistics. After thirty days, these points compress into one-hour summaries containing minimum, maximum, and mean values.
This historical downsampling systematically deletes the micro-burst variations that carry causal signatures.
Two events share one ten-second window. The compaction algorithm retains the total error count and the average duration across that window. When an investigation takes place three months later, the underlying execution sequences are gone.
The investigator holds aggregate numbers that confirm an incident occurred, while the mechanical progression from trigger to failure remains permanently unprovable.
Discarding granular intervals to economize on telemetry storage forces incident reviews into speculative debate.

Graph
Reconstruction models organize distributed telemetry into directed acyclic structures. Every node within the structure represents a bounded computational state or telemetry observation, while directed edges represent demonstrated causal paths. When telemetry feeds arrive in continuous asynchronous streams with incomplete ordering parameters, constructing this topology requires probabilistic inference rather than mechanical traversal.
The model evaluates temporal proximity, known service dependency mappings, and topological connection points to estimate the most probable traversal paths.
Independent timestamps conflict under skew. When two nodes record mutually incompatible event orders, the graph generation engine applies constraint satisfaction rules to isolate valid topologies. If service alpha can communicate with service gamma exclusively through service beta, an observed anomaly in gamma cannot precede an anomaly in alpha unless an unmonitored backchannel exists.
Structural system topology therefore acts as a physical filter that prunes mathematically invalid causal sequences generated by drifted local clocks.

Directed Edges Under Ambiguous Sequencing
Structural dependency mapping establishes the set of permissible causal edges. Modern enterprise applications deploy hundreds of decoupled services communicating through message buses, remote procedure calls, and distributed databases. By parsing static infrastructure descriptors, container orchestration manifests, and runtime connection tables, the reconstruction engine derives a directed graph of physical reachability.
This static graph forms the foundation upon which dynamic telemetry events are projected.
Dynamic telemetry projection transforms observed metric variations into path weights. A sudden elevation in CPU usage on an edge node followed by a queue backlog on an upstream message broker does not prove the edge node caused the backlog. If the static topology confirms that the message broker feeds the edge node, the causal arrow flows against the chronological observation order.
The edge node choked because the broker forwarded a malformed batch, despite the broker telemetry arriving at the collection interface several seconds after the edge node reported saturation.
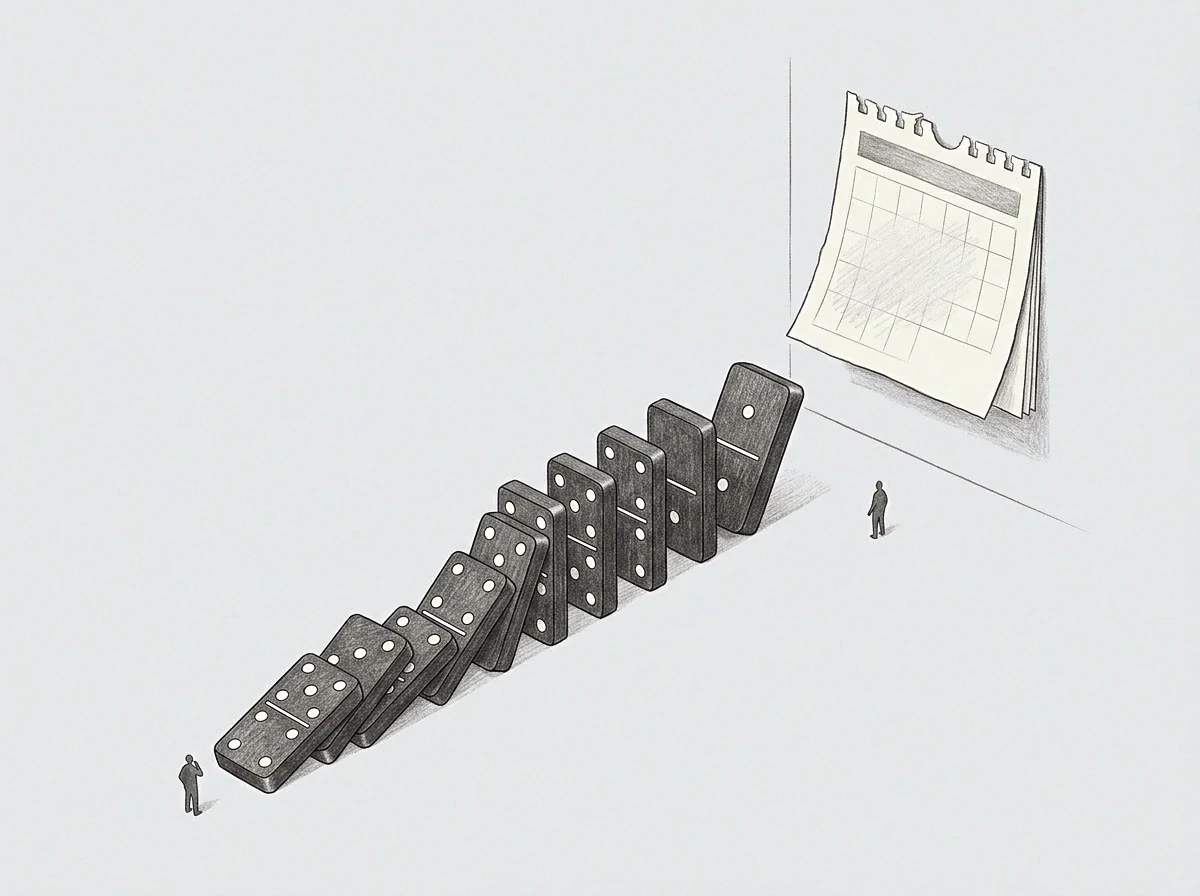
Tradeoffs in Trace Reconstruction
Engineers select telemetry ingestion architectures by balancing causal precision against compute overhead. High-fidelity tracing systems inject unique correlation identifiers into every thread context and network payload, logging explicit start and stop timestamps for every sub-operation. Aggregated metric streams bypass context propagation entirely, writing numerical totals directly to local memory buffers.
| Reconstruction Methodology | Temporal Resolution | Overhead Cost | Causal Ambiguity | Skew Resistance |
|---|---|---|---|---|
| Distributed Context Spans | Microsecond point execution | High compute and storage penalty | Zero under complete instrumentation | Total through logical sequence links |
| Vector Clock Ingestion | Sub-millisecond logical step | Moderate message payload growth | Bounded to concurrent execution sets | Complete independence from physical time |
| Bucketed Cross-Correlation | Fixed window interval | Minimal agent processing load | High inside common collection buckets | Vulnerable to hypervisor pauses |
| Topological Structural Inference | Window-bounded aggregate | Low continuous ingest footprint | Moderate across unmonitored services | High via network reachability constraints |
True causality demands a strict inequality. The choice of telemetry strategy dictates whether an incident investigation uncovers verifiable sequences or remains trapped in circumstantial pattern matching. Context propagation guarantees order, whereas bucketed telemetry trades definitive sequence data for operational economy.
The engineering team claims the monitoring platform provides comprehensive visibility because the dashboards render continuous lines.
Delay
Pipeline transport latency creates artificial chronological shifts in event streams. In distributed telemetry pipelines, metric agents buffer measurements before executing bulk network transmissions. Log collectors compress text segments into compressed archive blocks prior to dispatching them to the indexing cluster.
These asynchronous transport pipelines run on variable schedules dictated by batch size thresholds, thread availability, and local disk write speed.
The pipeline flushes on fixed intervals. Telemetry from an unresponsive node sits in memory buffers until resource contention subsides or an ingest timeout forces a batch release. When that delayed batch finally arrives at the ingestion gateway, its records carry collection timestamps that conflict with real-time events that occurred minutes later.
The indexing pipeline processes records out of order, writing them to disk based on ingest arrival time rather than the instant of execution.
A delayed telemetry stream produces phantom correlations when arrival timestamps overwrite execution timestamps.
Reconstructing genuine event sequences requires isolating transport delays from operational execution duration. When telemetry pipelines fail to record the precise duration an event spent sitting in intermediary transport buffers, the reconstruction engine conflates delivery latency with processing latency. An operation that completed in four milliseconds appears to have consumed five seconds if its completion notification sat inside an operating system socket buffer during an unrelated network freeze.
Asynchronous Pipeline Latency and Ingestion Skew
Ingestion queues process incoming telemetry streams using parallel worker pools. When multiple worker threads pull items from an unpartitioned event queue, processing time variations across workers alter the sequence in which items are committed to the analytical database. Worker one takes longer to deserialize a compressed log block than worker two takes to write a scalar metric point.
The scalar metric reaches searchable storage ahead of the log block, reversing their visible order in operational dashboards.
The downstream database stopped responding. When operators observe this event in their monitoring dashboard, they correlate it with the telemetry records visible in that exact second. If the log stream describing the upstream traffic spike was delayed by thirty seconds in a local agent buffer, the operators conclude that the database collapsed spontaneously under normal load.
Physical execution reality contradicts dashboard presentation.
Reconciliation of Out of Order Batches
Correcting out of order streams requires buffering windows at the ingestion tier. The ingestion engine holds incoming streams in an active evaluation window, delaying final causal sorting until an established watermark duration elapses. The watermark defines the duration the system waits for delayed records before declaring a time window closed for analytical updates.
- Watermark Threshold Definition establishes the temporal boundary beyond which late telemetry payloads are discarded or routed to cold archive storage.
- Logical Precedence Alignment cross-references incoming span identifiers against static parent-child schemas to restore execution hierarchies independent of ingest timing.
- Window Compaction Recomputation recalculates statistical percentiles and counter sums for previously closed intervals when late-arriving records alter historical boundaries.
- Causal Edge Validation verifies that reconstructed dependency edges do not form impossible loops across the recorded timeline.
A stated watermark threshold of thirty seconds ensures that late batches arriving within half a minute are incorporated into the primary causal graph, while records arriving after that boundary are permanently quarantined from the active sequence record.
Artifact
Reconstructed operational graphs require immutable digital records to serve as evidentiary standards. In post-incident reviews, human memory rapidly reconstructs technical sequences to match prevailing organizational assumptions. An engineer who believes an unfamiliar deployment triggered an outage remembers seeing latency elevate immediately following the release notification.
Another engineer who authored the deployed code remembers the database pool depleting prior to the code rollout. Memory defaults to the louder voice.
The written entry holds the interval. A verified causal artifact consists of a structured data export containing immutable cryptographic signatures, exact raw event payloads, explicit logical counters, and the precise state of the dependency topology recorded at the moment of failure. When an organization relies on dynamic dashboard views that query live databases containing downsampled metrics, the historical evidence shifts continuously beneath them.
A dashboard viewed on Monday displays different aggregated averages than the identical dashboard viewed thirty days later after downsampling routines process the underlying tables.
An immutable telemetry record protects post-incident analysis from the systematic distortions of human recollection.
Constructing a defensible causal record demands capturing raw trace spans and sequence-stamped state mutations before compaction algorithms discard the connective edges. This operational discipline carries concrete costs in storage capacity and engineering hours. The organization that commits to persisting fine-grained logical sequence artifacts pays that overhead once during steady-state execution, preventing weeks of circular debate when an ambiguous failure occurs.
Preserving Causal Lineage Before Downsampling
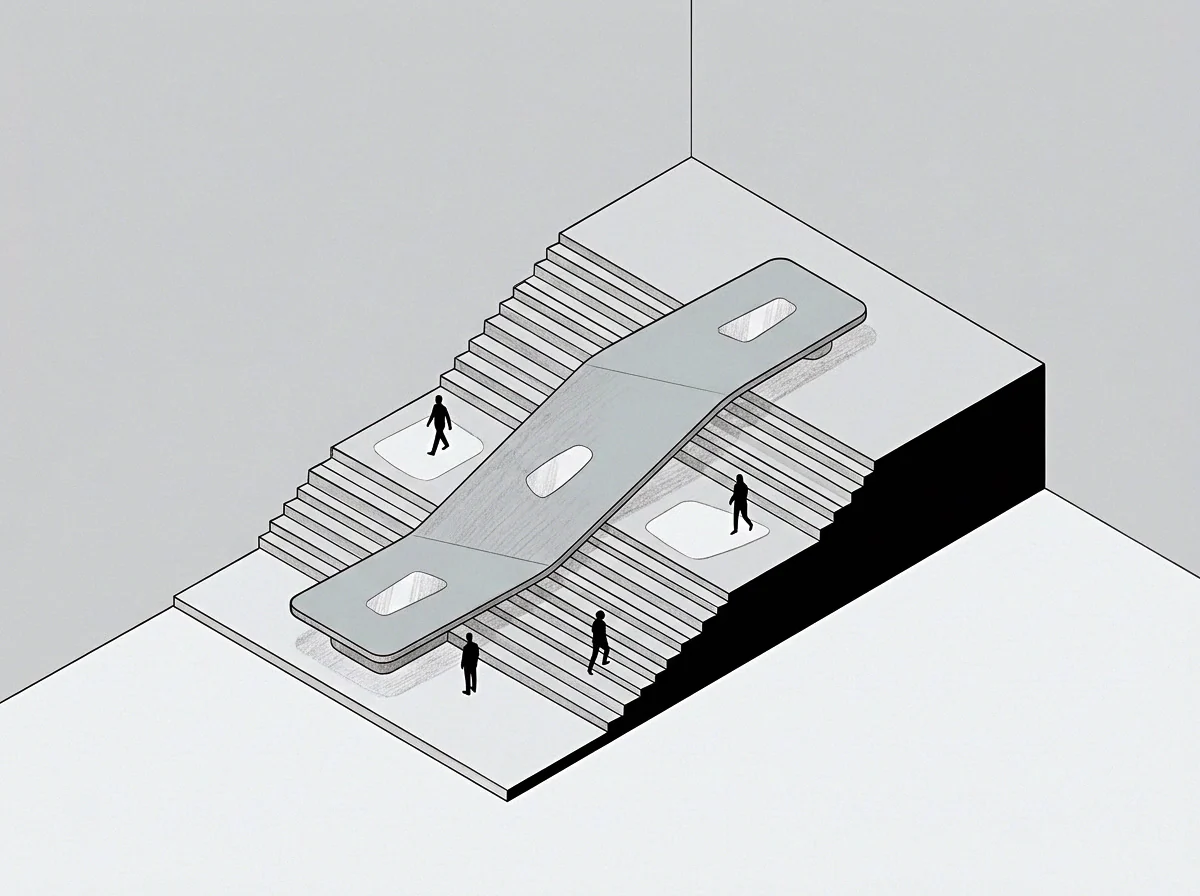
Long-term telemetry architecture must isolate causal lineage metadata from broad numerical metrics. While volumetric counters and average latency indicators can be safely downsampled into rolling percentiles, the explicit parent-child linkages between distributed execution contexts must be extracted and persisted in specialized directed graphs. These trace lineage graphs consume minimal storage compared to raw payload dumps while preserving the exact dependency paths of critical operations.
Every compaction drops individual sequences. Preserving lineage graphs before running destructive aggregations provides engineers with an enduring structural scaffold. When an operator investigates historical incidents months after their occurrence, this scaffold allows high-level metric trends to be mapped back onto true execution paths rather than inferred through guesswork.
The Defensible Record of System State
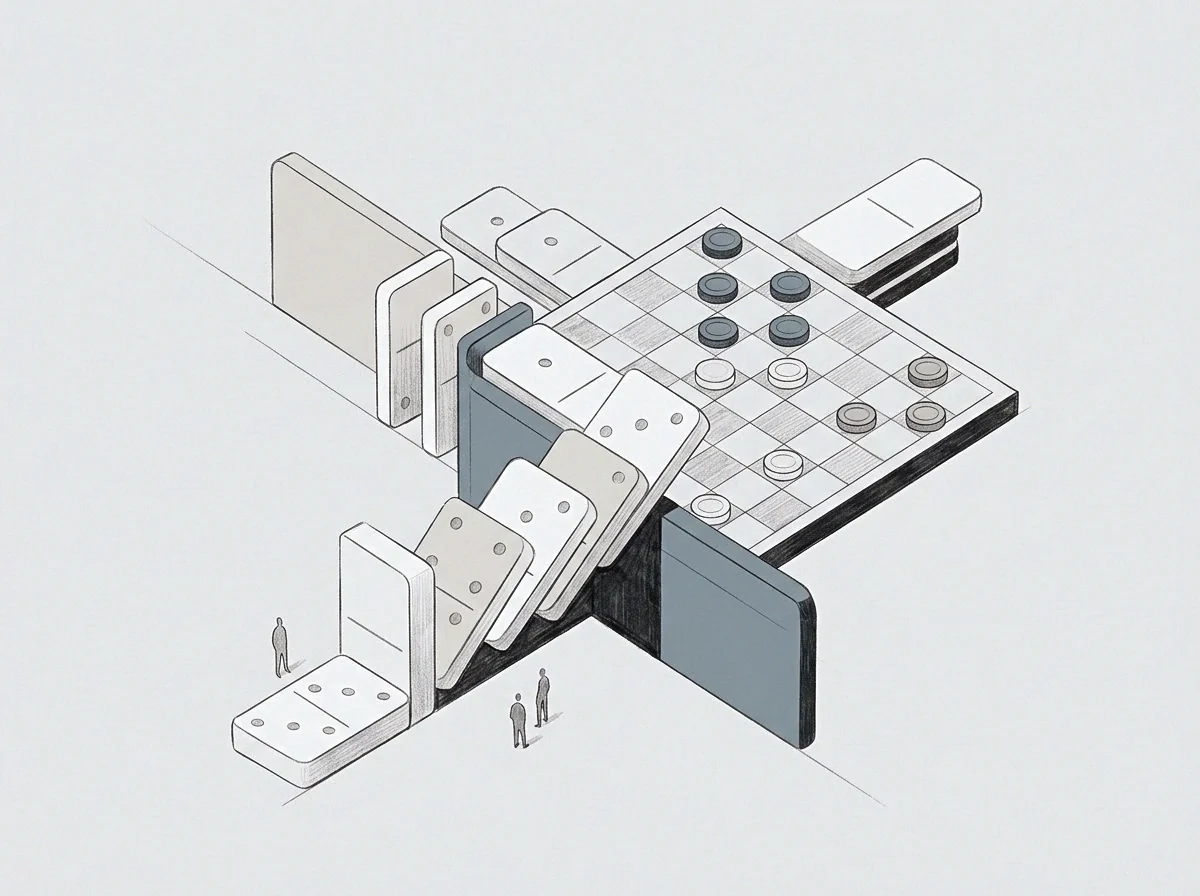
The defensible record binds telemetry to organizational accountability. During an incident, the technical system executes millions of state transitions that leave disjointed fragments across asynchronous collection buffers. Capturing these fragments into a sealed, non-adjustable snapshot creates an anchor that settles disputes between engineering groups, infrastructure vendors, and executive leadership.
The operator signs the audit log. That action freezes the reconstructed causal graph at a specific evaluation state, terminating speculation regarding root failure conditions. The system boundary either performed within its contract or it violated that contract, and the recorded causal sequence provides the physical proof that arbitrates the claim.
Whether distributed telemetry systems can eventually automate the continuous synthesis of absolute causal orders from entirely asynchronous and uncoordinated aggregations without human topological hints remains an open engineering question.